When it comes to the fight against the coronavirus, we have an advantage we didn’t have in the SARS outbreak of 2003 – big data. We have a lot of data and modern technology available to help researchers and scientists track and contain this pandemic, much like China did when they used machine learning and big data to track the spread of the virus.
This has spread throughout the world as other countries also step up their efforts to fight COVID-19. With the help of real-time forecasts and digital technology, researchers and decision-makers have the information they heed to predict the impact of this outbreak.
“The real question here isn’t can we predict disease outbreaks with big data technology? but rather: are we willing to trust and act on this data quickly enough to make a difference?“
Tracking Infected People with Surveillance
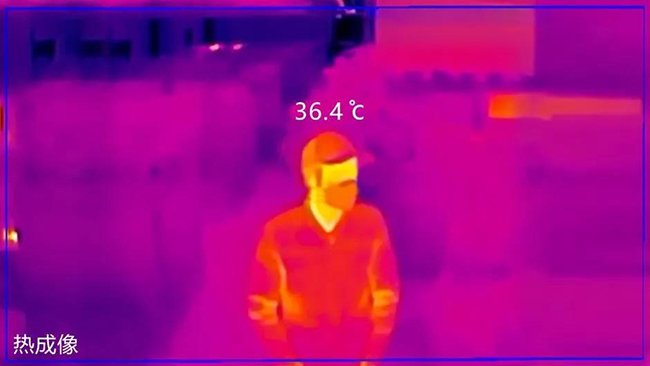
China has put its tracking systems to good use in its response to COVID-19. They’ve installed thermal scanners in train stations to detect high temperatures, which could indicate a potential infection. If a patient tests positive, health officials will track and trace everyone who might have come in contact with the infected person and ask them to self-quarantine.
China has millions of cameras throughout the country that are used to track citizens. Mobile phone data is also used to track people’s movements. If found that they are not in quarantine when they were supposed to be, authorities are called. Travel data is provided to determine what cities a person visited, to determine if they should be in quarantine.
This is just one example of how big data analytics are used in the fight against the coronavirus.
Contact Tracing with Mobile Apps
Although people in the US and Europe have even bigger privacy concerns than those in China, medical researchers and scientists understand the power of big data analytics to support contact tracing. Government officials worked with Oxford University’s Big Data Institute to show the benefits that could be provided by a mobile app in the control of the virus. Speed is crucial since almost half of the infections occur when people are not yet showing any symptoms at all.
MIT is busy developing a way to use mobile technology to trace people without compromising their privacy. When someone tests positive for COVID-19, the names of those who did come in close contact with the person can be downloaded by healthcare providers without accessing their travel movements.
Using GIS to Map Outbreaks
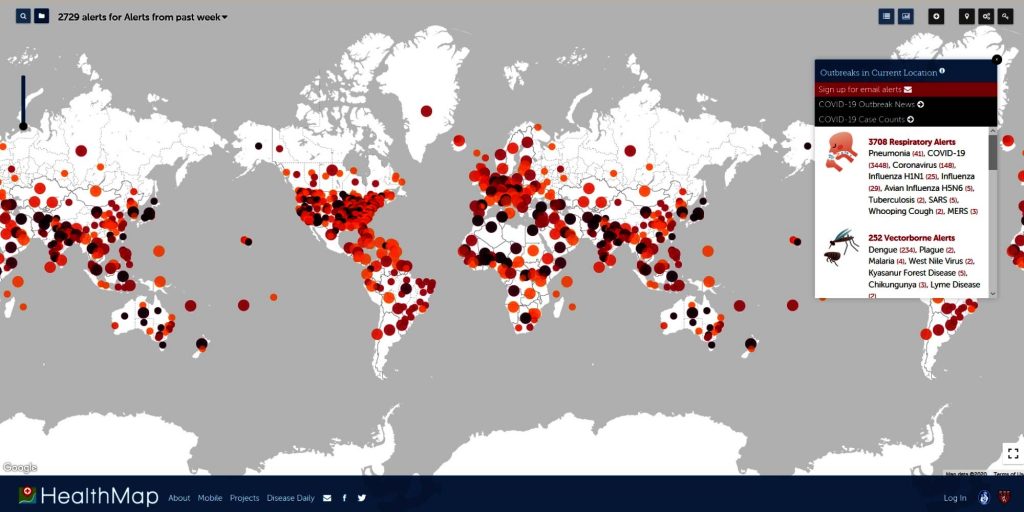
Geographical Information Systems, otherwise known as GIS, have proven vital for both tracking outbreaks but also delivering neat visualisations that can be interpreted by any interested party rapidly.
Organisations such as Johns Hopkins and the World Health Organisation are working with ArcGIS to spin up and visualise easy to consume country level data.
Governments, national and local, are also taking advantage of GIS technology to keep their citizens informed. The data that sits beneath GIS software is vast, the output simple.
The is the beauty of platforms such as ArcGIS – is their versatility.
On one hand we have a map based data visualisation, with most being geographically literate enough to comprehend the crisis in their region quickly. On the other hand, the ability to explore millions, if not billions of unique records to dynamically discover where outbreaks occur. Not just occur, but where they are likely to spread or be contained the fastest, at the most local of levels.
Check out the section below for some examples of Geographical Information Systems (GIS).
Official Dashboards to Track the Outbreak
We wrote recently about the resources available to collate information from various public and official sources. Various dashboards from organizations like the World Health Organization are helpful to show the progression of the virus; it also aids policymakers and decision-makers in the process. Various dashboards pull in data from multiple sources and can show statistics such as infection rates.
Models of this disease are created by using all available data, such as the number of deaths, population densities, contact tracing, traveler flow, and more.
Technology has proven to be vital in the fight against the coronavirus as well as future pandemics. Along with being able to predict the flow and modelling the virus, machine learning and big data can help us figure out how to be best prepared for future pandemics.
Gathering insight but keeping on the right side of intrusion, in terms of user privacy, may the conundrum our governments, institutes and private organisations will have to resolve.
The real question here isn’t can we predict disease outbreaks with big data technology? but rather: are we willing to trust and act on this data quickly enough to make a difference?