As a Data & Optimisation agency, we spend lots of time evaluating customer journeys, user behaviour and the audiences that sit behind them.
We have highlighted our process for approaching customer journey analysis.
Getting started with stakeholder workshops
Our first port of call is typically to run a workshop with clients to help identify where they feel their typical user journeys lie on their sites and apps.
This is useful for gathering contextual insights from users who know the most about the customer and the experience. It also helps us identify where gaps in the client’s knowledge may be. It helps identify opportunities for growth beyond any preconceived ideas.
We then use several quantitative methods to uncover data-driven insights, detailing touchpoints, common paths, multi-channel and multi-device funnels.
These may sit in line with the maps created in client workshops, but some may not.

Web Analytics tools are fundamental data sets for any site or app
Using data sources such as Web Analytics tools (e.g. Google Analytics, Adobe Analytics and Piwik) allows us to identify the “what” or “which”.
Simply, this might be something like “what are the most common paths our customers take through the site?”
The big advantage to using web analytics platforms and the like, is that the data is replicable, can be segmented and can be interrogated in hundreds of different ways to identify user journeys and related data points.
Visual analysis adds context to the hard numbers
However, using tools such as HotJar adds colour to our quantitative analysis. Web Analytics as good as its implementation.
Historically, events such as button clicks, scroll rate and video plays might not have been tagged – or the time to implement is a barrier to commencing work.
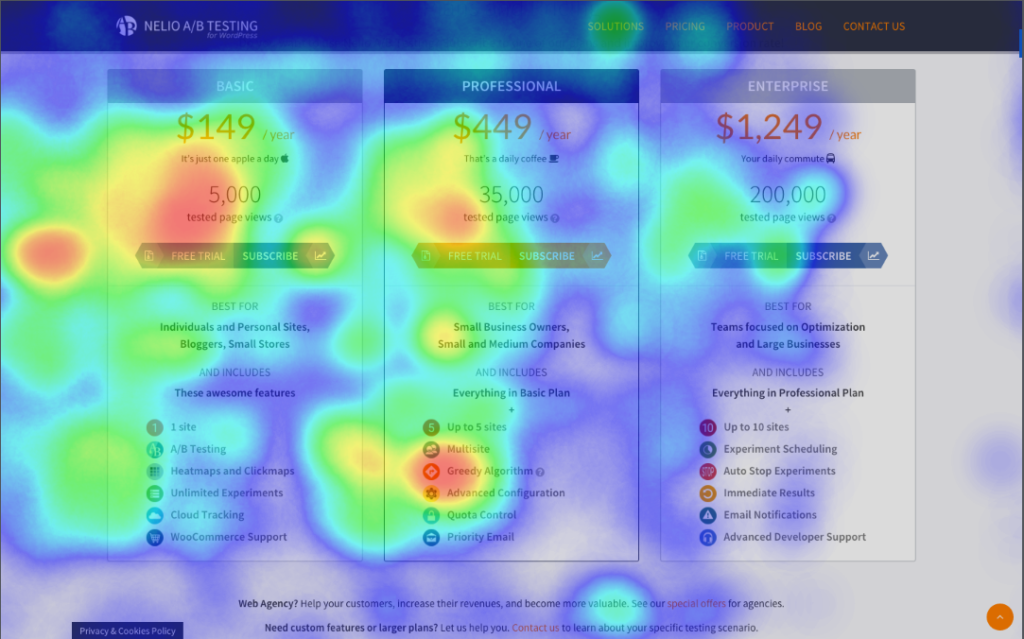
This is where HotJar comes in; click and scroll maps allow us to quantify user behaviour in a much more granular way, which complements the trend data we collect from web analytics.
This is where we start bridging across to “Why” i.e. “Why do users take Path A 30% more frequently than Path B?”
From page to page this can be difficult to tell using only Google Analytics and similar tools.
Heatmapping can generate the initial “Eureka!” moment – you can neatly quantify and visualise how users navigate between pages.
Qualitative data sets help to understand the person behind the user
At this stage, Qualitative data comes into its own. Understanding the human response to the “What” is important for adding vital context. For this, we use a variety of techniques.
Utilising Surveys
Surveys, when used correctly, can offer short and sharp qualitative responses from users embarking or about to embark on a certain path. Again it adds great context to the analysis.
It turns theory and hypothesis into firm insight, “the price is too high”, “I need to see some more reviews to check out whether this company is legit”, “I’m not sure how long it will take to arrive”.
Focus groups can help expand and explore key themes
Where it makes sense, focus groups and individual interviews are also great sources of information. Thousands of words of information can be collected from each user – often with the same questions, concerns and user stories corroborated.
Session replay can help uncover vital insights in less time
For clients with smaller budgets, or faster time to completion, session replay is also a great tool to understand how users consume content and act on it, at each stage. Session replay data is vast and varied, with the ability to hone in on individual journeys, cohorts, experiences and device-level insights quickly.
Should you use quantitative or qualitative analysis?
It’s vital to use both quantitative and qualitative methods to determine user journeys: Using quantitative methods such as web analytics or operational data will lead you to the “what” or a hypothesis, a hunch and feeling but not necessarily the iron clad insight and definitive insight.
Qualitative methods add a human element to journey mapping. Honest, in the moment feedback is worth its weight in gold, even if it is sometimes brutally to the point. It adds process time to both data collection and analysis, which is why some analysts shy away from these exercises.
Qualitative analysis allows for the collection of vital information from a cross-section of users, who are not suffering potential misconceptions and other bias that you may be unwittingly blinded by.